Know your numbers before the rankings do
QS and THE build their research indicators from Elsevier’s Scopus data. Discover RIMS gives your planning office its own view of the research activity those indicators measure, namely output, citations, journal quartiles and international co-authorship, by faculty and by year, so you can see trends and fix attribution gaps early.
- Covers
- Output, citations, quartiles, collaboration
- Breakdowns
- By faculty and by year
- Exports
- PDF reports; Excel and PDF lists
- Data source
- OpenAlex, not Scopus
Ranking indicators are built from data you do not control
In the QS World University Rankings, the Research and Discovery lens carries half the weight: Academic Reputation at 30% and Citations per Faculty at 20%, with citations drawn from Scopus. International Research Network, also based on Scopus, adds 5% within the Global Engagement lens. In the THE World University Rankings, research quality carries 30%: citation impact at 15%, and research strength, research excellence and research influence at 5% each, all from Elsevier data.
The research office cannot change those methodologies, but it can understand its own output: which faculties are growing, where papers are published, who the institution co-authors with, and whose work may be missing from the record because identifiers are incomplete.
What the planning office gets
All of it in the admin analytics view, filterable by faculty and year.
-
Output and quartiles by year
Publications per year over the last twelve years, split by SJR journal quartile, with the share of output that has a quartile and the number in top-10% journals.
-
Scopus-indexed share
Output in journals on the Scopus source list against other output, year by year. This is the closest internal proxy for what Scopus-based rankings can count.
-
Citations per year
Citations across the institution by year, to show whether impact is rising or falling.
-
Faculty comparison
The top ten faculties by publications, by citations and by the sum of their researchers’ h-indexes.
-
International collaboration
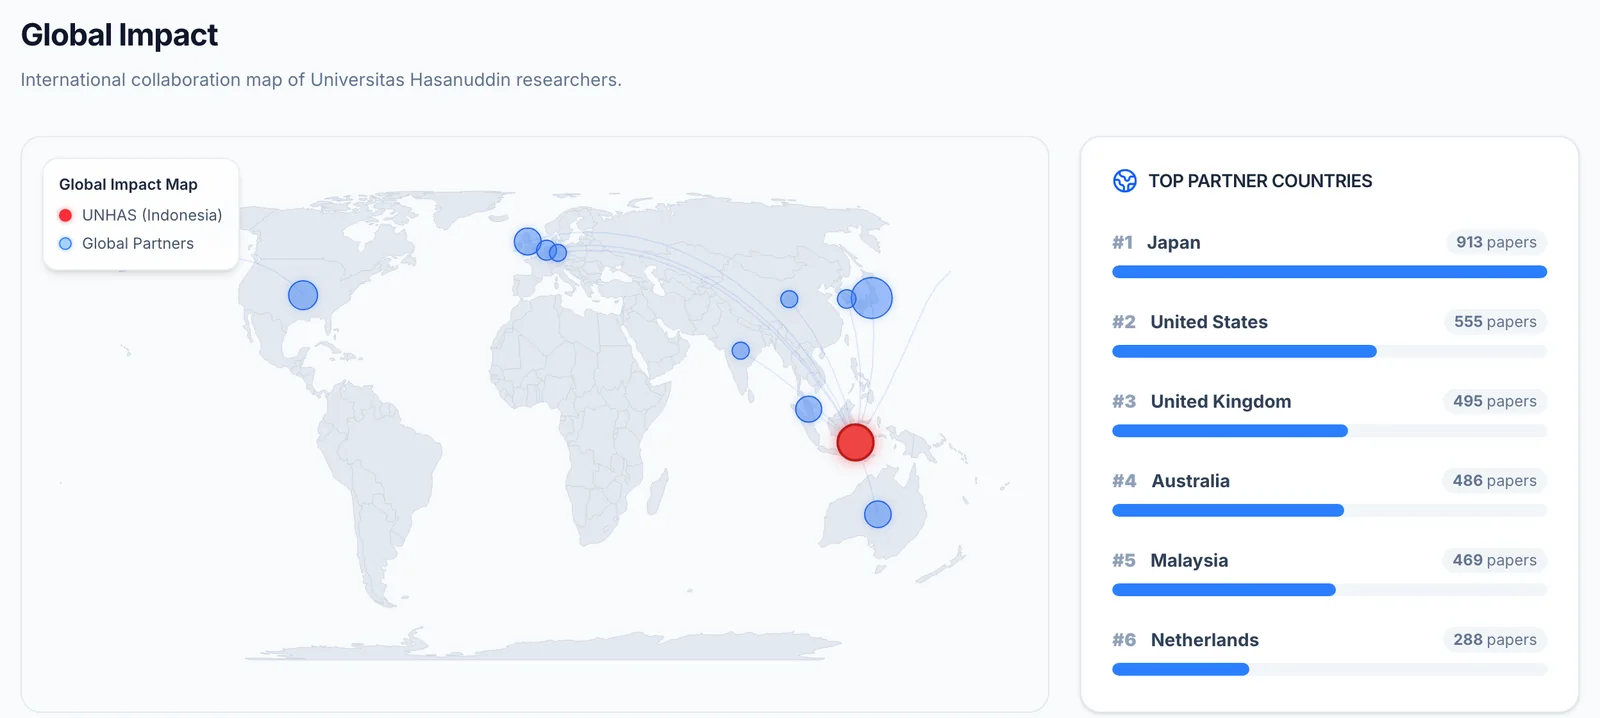
Partner countries and institutions from co-author affiliations, with the top partner countries on the public global impact map.
-
Data completeness
How many researchers have an ORCID iD or a Scopus Author ID, and how many publications have an abstract, a journal and a quartile. Gaps here are usually the cheapest thing to fix.
-
Reports
An executive analytics PDF, a publication data report per faculty, and Excel or PDF exports of up to 20,000 publications from any search.
What it does not do
Stated plainly, because ranking figures are high-stakes.
- It does not submit data to QS or THE, and it does not calculate their indicators, such as Citations per Faculty or field-normalised citation impact.
- Publication counts and citations come from OpenAlex, so they will not match the Scopus figures QS and THE use. Use them for trends and internal comparison, not to predict a ranking score.
- Journal quartiles use one SJR edition for every year, and the top-10% flag describes the journal, not how often the paper is cited.
- Reputation surveys, staff and student numbers, and income data are outside its scope.
Where the data comes from
Each figure in the analytics view traces back to one of these sources.
- Publications and citations OpenAlex Publication counts, citations per year, and co-author countries and institutions.
- Author IDs and indexed journals Scopus The Scopus source list behind the Scopus-indexed share.
- Journal quartiles Scimago Journal quartiles and the top-10% journal flag.
- Researcher identity ORCID Researcher identifiers that make attribution complete.
Further reading
- Guide University Rankings & Research Intelligence: A Guide for Research Leaders What QS, THE and ARWU actually measure, why research-data quality is the decisive lever, and how a modern RIMS turns the annual scramble into continuo...
- Insight Bibliometrics for Ranking Submissions: h-index, FWCI and Citation Impact What the core bibliometric indicators measure, what distorts them, and why data reconciliation is the prerequisite for any credible ranking submission...
- Insight Internationalisation Metrics: Measuring Global Research Collaboration How to quantify international co-authorship, partner-country distribution, and collaboration trends — and turn them from anecdote into strategy.
- Insight How a Modern RIMS Strengthens QS, THE & ARWU Ranking Submissions Rankings run on clean, reconciled research data. How a modern RIMS turns the annual scramble into continuous, evidence-led readiness.
Sources: QS World University Rankings methodology · QS Citations per Faculty · QS International Research Network · THE World University Rankings methodology
Questions about ranking preparation
Not covered here? Ask us directly
No, and they should not be read that way. QS and THE use Scopus data with their own normalisation; Discover RIMS uses OpenAlex. Expect similar trends and different absolute numbers.
It shows where your own record is incomplete: researchers without an ORCID iD or Scopus Author ID, and publications without a journal or quartile. Correcting affiliations in Scopus itself is done with Elsevier.
Not specifically. ARWU uses indicators such as prize winners, highly cited researchers and papers in Nature and Science, which the platform does not track.
Yes. The analytics view filters by faculty and year, and faculty-level administrators see their own faculty only.